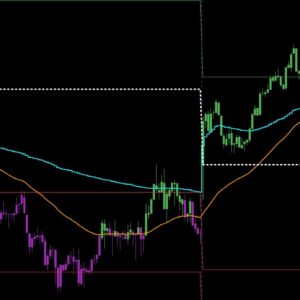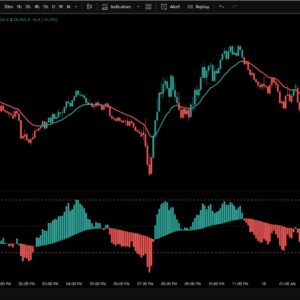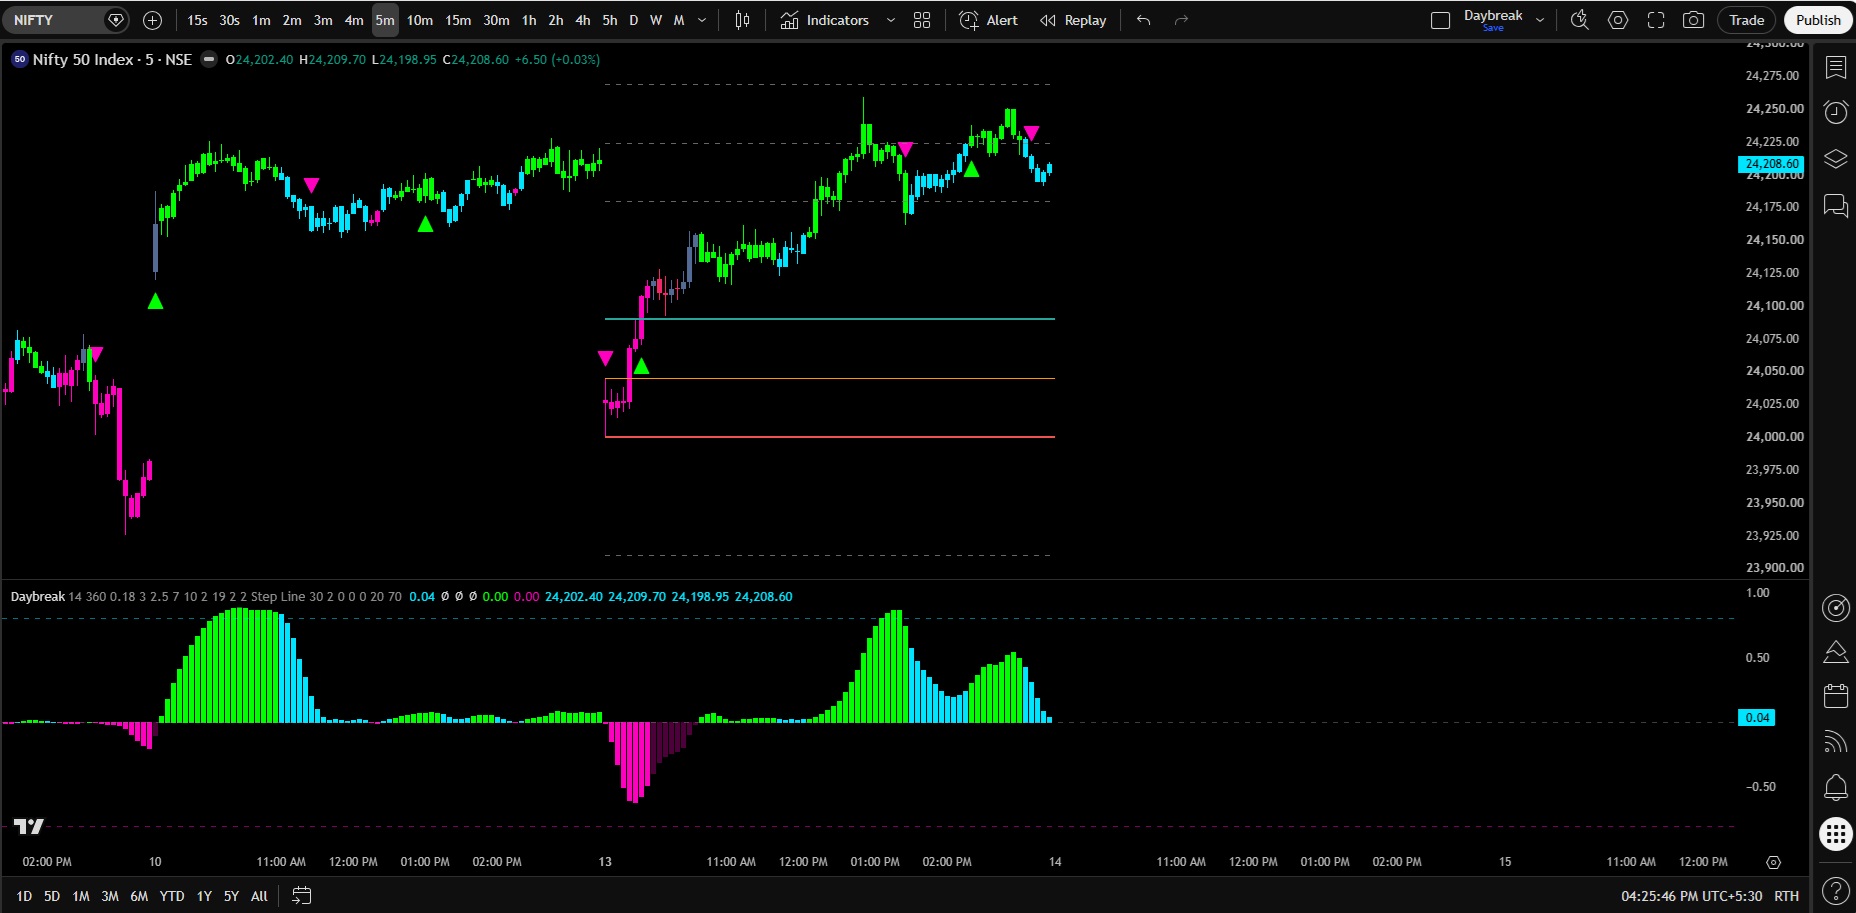
Description
Overview
Daybreak is a single, self-contained indicator that brings together two previously separate tools — a momentum-driven candle coloring engine and an opening range breakout system — into one unified chart layer. Everything the trader sees, from candle color to the projected opening range, is generated and controlled from a single script, with no separate panes to configure and no additional indicators to add.
The design philosophy behind Daybreak is straightforward: the bottom-layer momentum read should drive what happens on the price chart itself. Rather than showing a momentum oscillator in isolation and leaving the trader to mentally cross-reference it against price, Daybreak applies that read directly to the candles, so the state of the market’s underlying momentum is visible at a glance, every bar, without switching panes or splitting attention.
The Momentum Engine
At the core of Daybreak sits a directional momentum oscillator built on the Directional Movement Index (DMI). The positive and negative directional components, along with trend strength (ADX), are each smoothed and normalized, then combined into a single bounded value that reads as a continuous measure of directional pressure — how strongly, and in which direction, the market is currently leaning.
This value is smoothed a second time to produce a slower reference line. Comparing the raw oscillator against this reference produces a three-state read: strong agreement in one direction, strong agreement in the other, or a transitional state where the two are not yet aligned. This three-state read is the single signal that governs candle color throughout the chart.