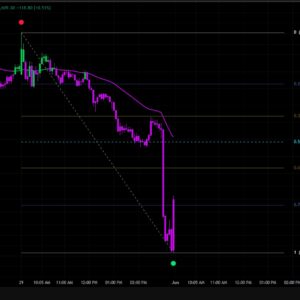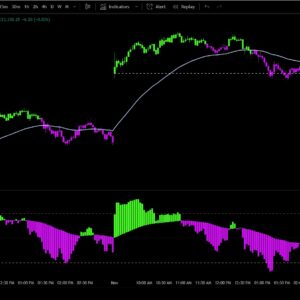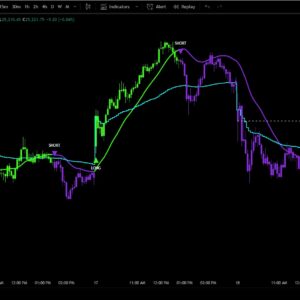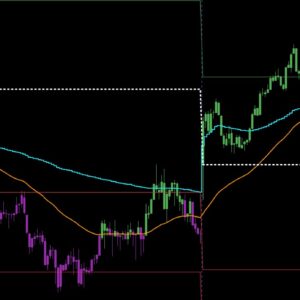
Description
Overview
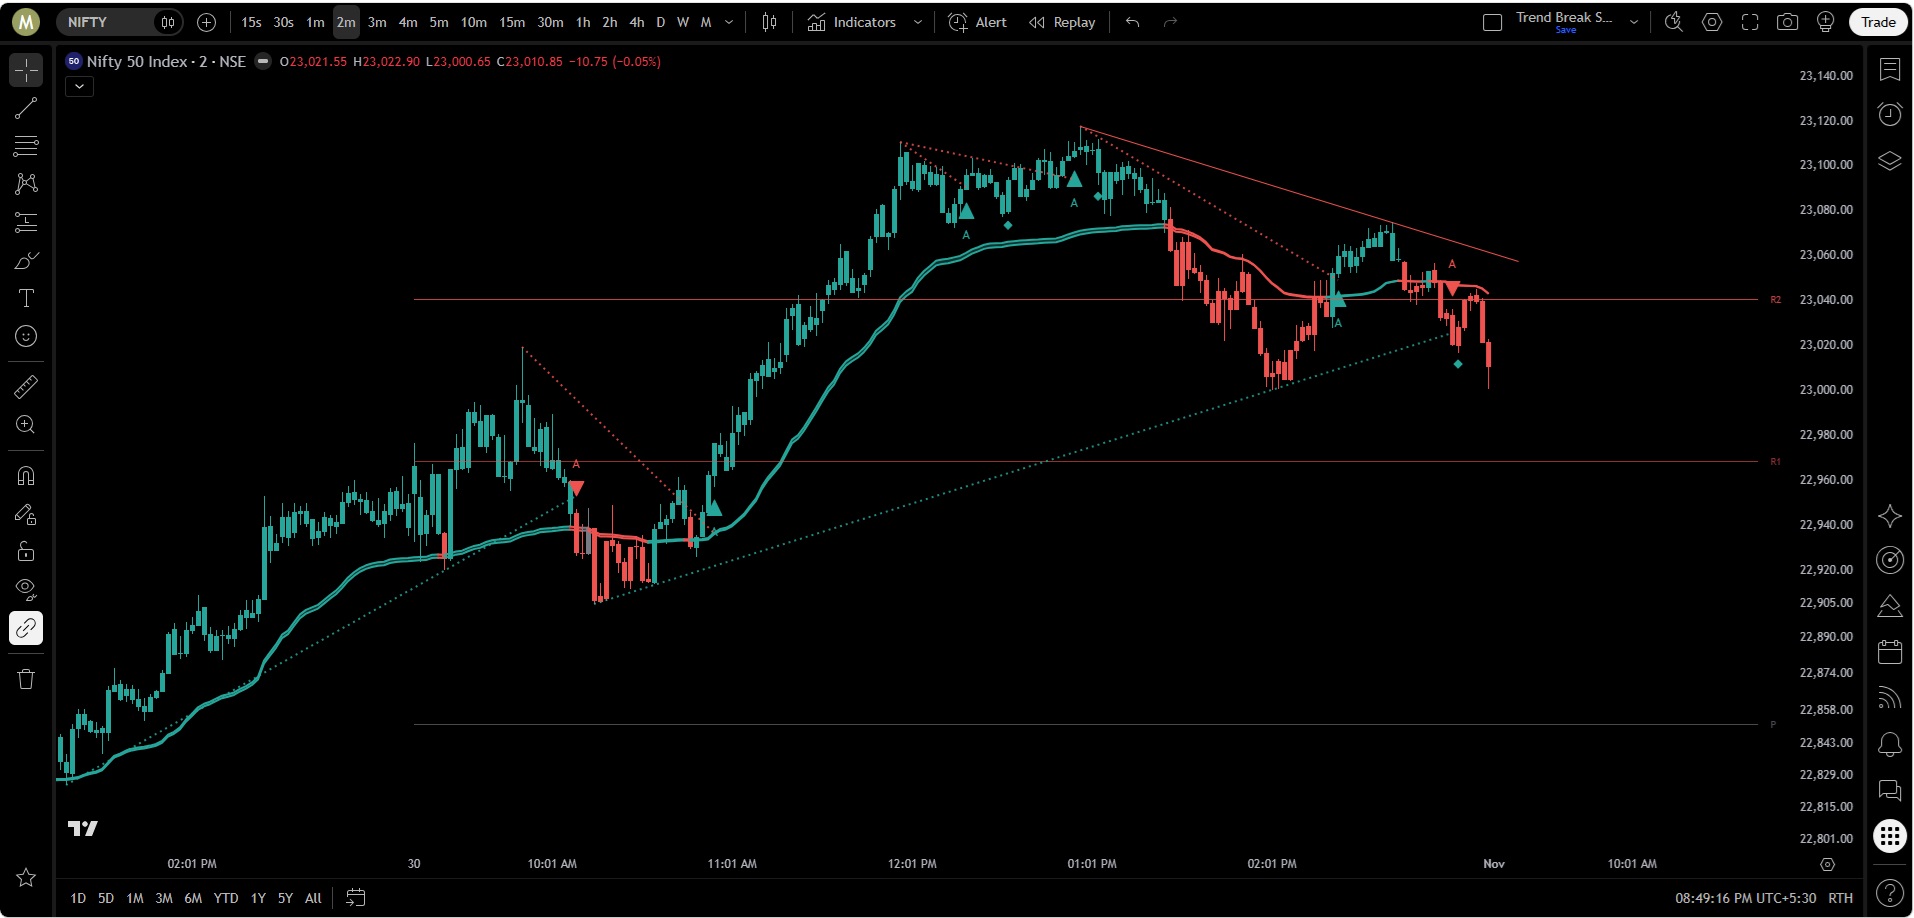
A trendline break is one of the oldest and most trusted signals in trading, and also one of the most abused. Lines are drawn by eye, at convenient angles, and every poke through them gets called a breakout. Trend Break Scanner V2 was built to take the guesswork out of it: it finds real trendlines, checks them against price before drawing them, and only calls a break when the move has the energy and momentum to back it up.
To judge that energy it borrows from Einstein’s most famous equation, energy equals mass multiplied by the speed of light squared. A move carries real energy only when meaningful participation (mass) meets fast, decisive price travel (velocity). A slow drift on thin participation is not the same as a sharp, well-attended push, and Trend Break Scanner V2 is built to tell the difference.
Trend Break Scanner V2 is the complete rebuild of the original Trend Break Scanner, merged with the E=MC² energy engine into one instrument. On a single chart it reads the energy behind a move, the momentum state of price, the live trendlines price is respecting or breaking, and the key daily reference levels. Each layer answers a different question, so the trader reads one coherent story instead of juggling several separate tools.
What makes Trend Break Scanner V2 Stand Out
- Physics, not guesswork. The energy engine weighs both participation and speed, and squares speed so decisive moves stand out clearly from drift.
- Trendlines that earn their place. Lines are anchored to real swing points and checked against price before they appear. Lines already broken are never shown as live.
- Breaks with a pedigree. A volatility buffer, a volume check and an A/B grade tell you not just that a line broke, but how much the rest of the market agrees.
- The retest built in. Many traders miss the first break and wait for the pullback. Trend Break Scanner V2 marks it for them.
- Context in the same view. Daily Fibonacci pivots, optional swing Fibonacci, EMA and VWAP sit alongside the signals, so targets and reference levels are always in sight.
- Clean by design. One live line per side, faded history, and the heavier modules off by default keep the chart readable even on busy sessions.