Description
Overview
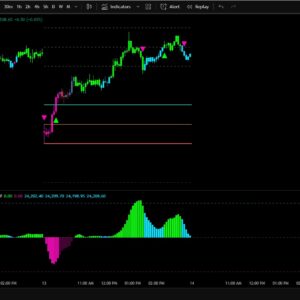
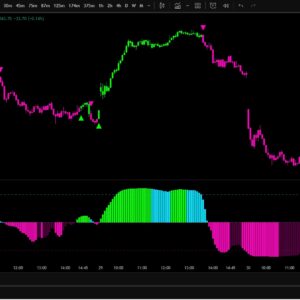
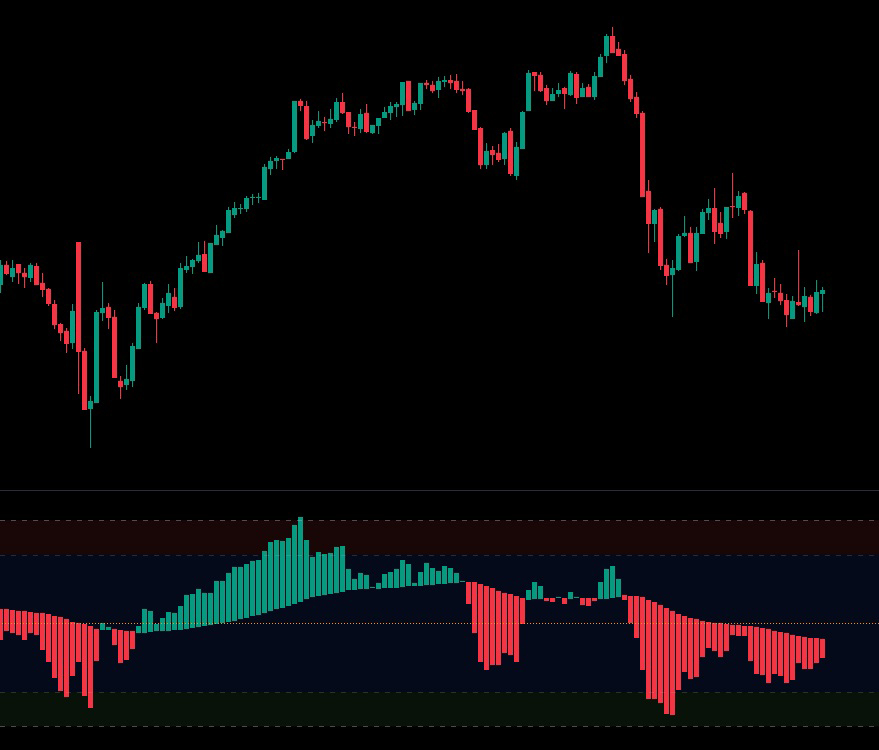
WAVE RSI is an advanced momentum visualization tool designed to represent the rhythm and flow of market strength and weakness as smooth, color-coded waves. It converts traditional RSI data into a dynamic wave-form candle structure that eliminates noise and highlights transitions in momentum with clarity. The result is a clean, fluid representation of market pressure—ideal for traders seeking an immediate visual understanding of momentum buildup, exhaustion, and reversal.
Concept
Traditional RSI indicators use a single line that oscillates between overbought and oversold levels, which can make it difficult to interpret short-term changes in momentum. WAVE RSI redefines RSI visualization by expressing momentum as structured, color-based candles. Each candle captures both direction and intensity, forming a continuous ‘wave’ of strength or weakness. This transformation simplifies analysis by turning momentum shifts into easily visible patterns, helping traders quickly identify emerging trends or fading impulses.