Description
Overview
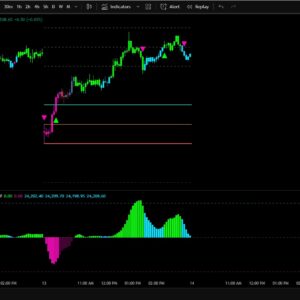
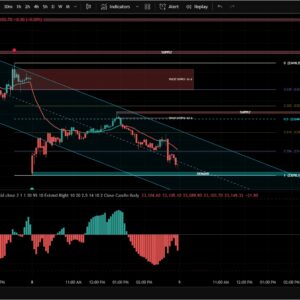
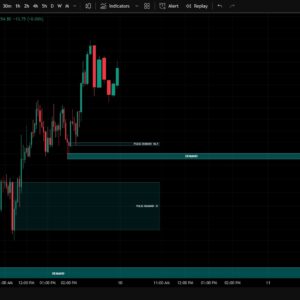
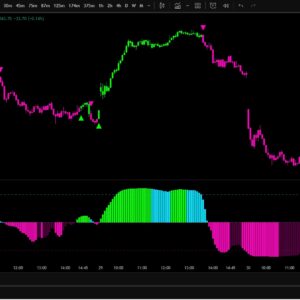
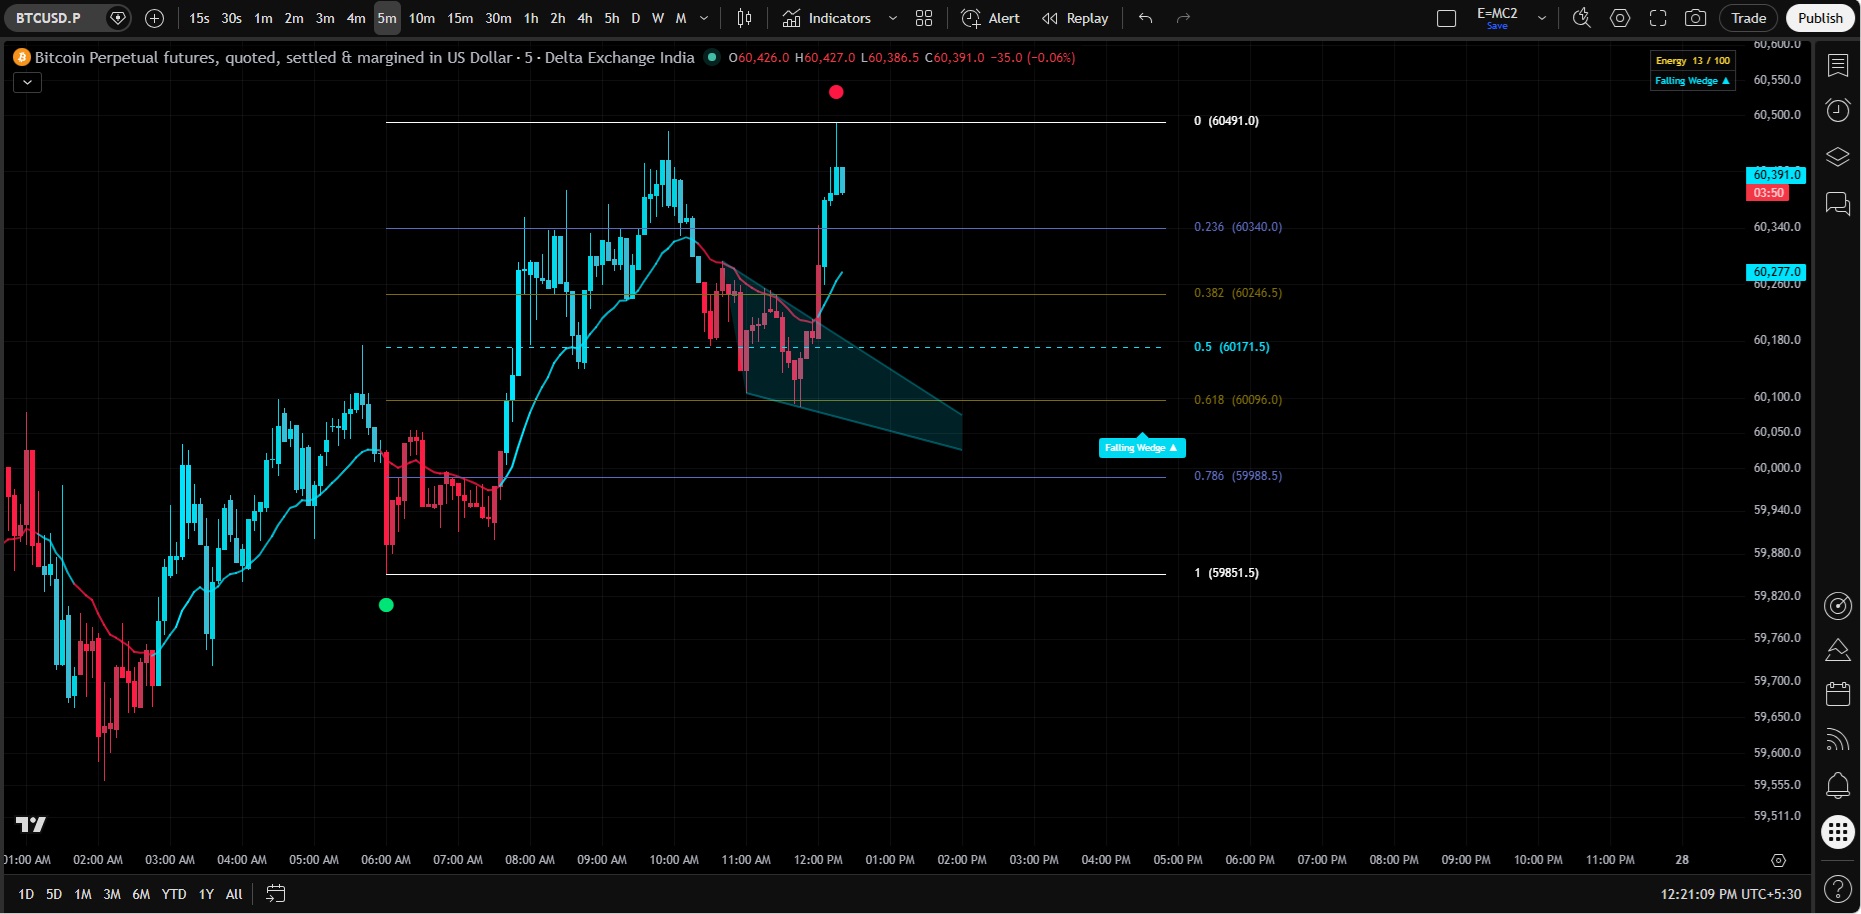
E=MC² is a multi-module technical indicator built for TradingView in Pine Script v6. It is designed for active traders operating across equity indices, futures, and cryptocurrency markets. The indicator combines a physics-inspired momentum engine with dynamic candle coloring, an adaptive EMA overlay, automated chart pattern detection, and an Auto Fibonacci retracement module — all unified within a single, clean overlay on the price chart.
Rather than cluttering the chart with a separate pane of oscillators and histograms, E=MC² expresses everything through the candles themselves and a compact information table, keeping the trader focused on price action while providing quantitative context beneath the surface.
The core of the indicator is a momentum energy calculation inspired by Einstein’s mass-energy equivalence: E = MC². In this adaptation, the formula is mapped to market dynamics as follows:
- C (Velocity) — Rate of Change of price, normalised by ATR to account for volatility across different assets and timeframes.
- M (Mass) — Relative volume, expressed as current volume divided by its smoothed average. Higher-than-average volume amplifies energy.
- E (Energy) — The product M × C² × sign(C), producing a signed momentum value. Positive E indicates bullish energy; negative E indicates bearish energy.
Raw E is smoothed with a 3-period Weighted Moving Average to reduce noise, and a signal line (EMA of E) is computed for crossover detection. A normalisation window converts absolute E values into a percentile score (e_pct, 0–100), making the reading comparable across all market conditions and timeframes.
The e_pct score drives two key outputs: the intensity of candle coloring, and the classification of market state. A score below 30 indicates a low-energy coil phase. A score of 70 or above combined with a directional signal crossover constitutes a high-conviction Burst event.