Description
Overview
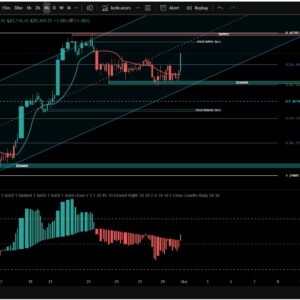
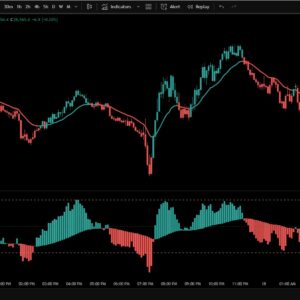
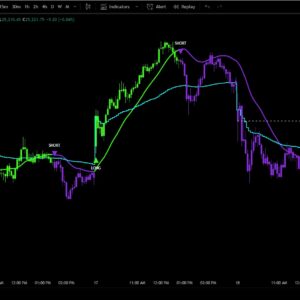
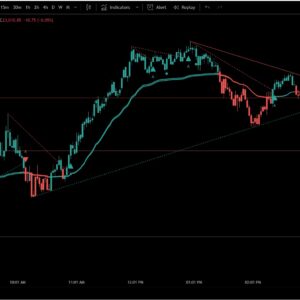
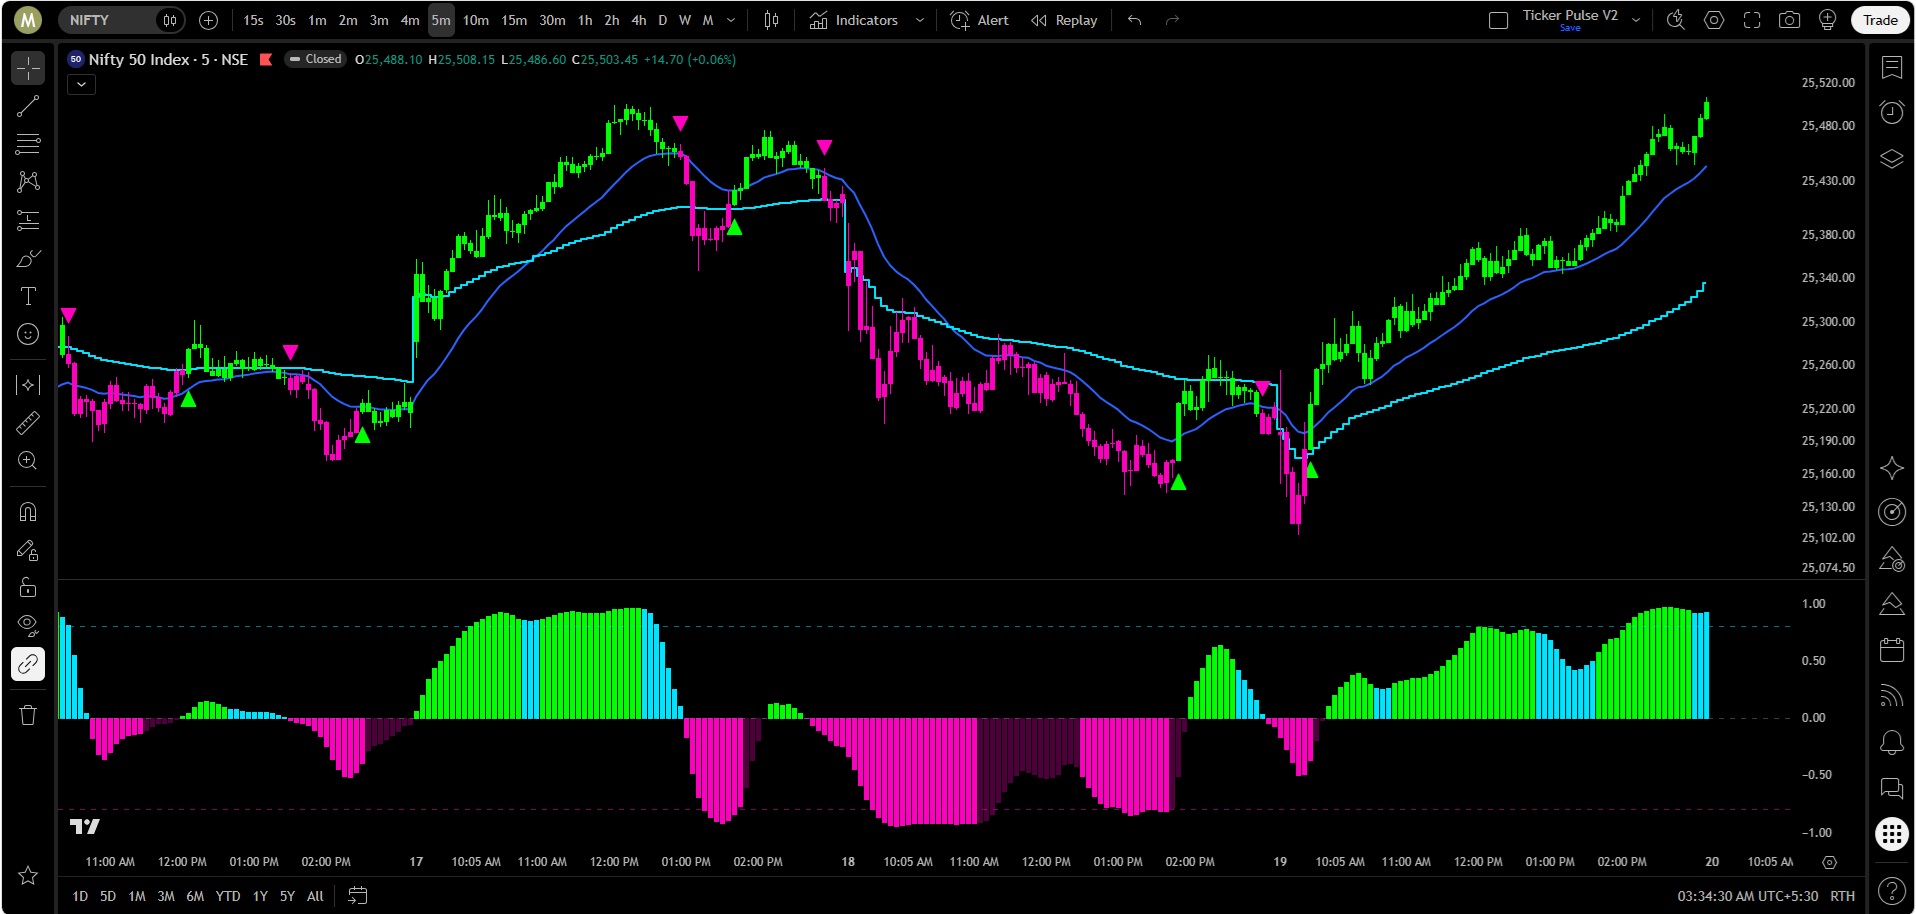
Ticker Pulse V2 brings two proven tools into a single indicator. Ticker reads trend on the price chart through an ATR trailing stop, colouring every candle and marking each reversal with a triangle. Pulse measures directional strength in its own pane below the chart, through a DMI-based oscillator drawn as a colour-coded histogram.
Until now, these were two separate scripts that had to be added one at a time. Ticker Pulse V2 delivers both from one script and one installation, while keeping every colour, every candle flip and every histogram bar exactly as the two originals draw them. Nothing about how they look or behave has been traded away to make them fit together.
By Default, VWAP is on for intraday, once you turn VWAP off via settings, Ticker Pulse is equally at home on longer time frame charts as well.
How It Works
Ticker: the trend on the price chart
Ticker places a trailing stop at a set distance from the middle of each bar, measured in multiples of the Average True Range. In an uptrend the stop can only rise; in a downtrend it can only fall. When price closes through the stop, the trend flips, the candles change colour and a triangle marks the turn. Because the distance is scaled to ATR, the stop widens in fast markets and tightens in quiet ones, so it adapts to each instrument and session without manual tuning.
Pulse: the strength underneath
Pulse starts from the Directional Movement Index: the buying pressure (+DI), the selling pressure (−DI) and the trend strength (ADX). Each is compared with its own long-run average and passed through a smooth logistic curve, so readings are judged against what is normal for that market rather than against fixed numbers. The result is combined, weighted by trend strength and compressed into a single line that moves between −1 and +1.
Above zero, buyers are in control; below zero, sellers are. The further from zero, the stronger the side in control. Pulse also compares the reading with its own short average, which tells you whether that strength is building or fading.
Two engines, one script
The candles on the price chart follow Ticker. The histogram below follows Pulse. Each keeps its own logic and its own colour settings, so a change to one never alters the other. This is deliberate: Ticker answers “what is the trend?”, Pulse answers “how much force is behind it?”, and seeing both at once is what makes the pairing useful.